Monday, August 17, 2020

Customs padlocks 10 Bulacan rice mills

 Customs padlocks 10 Bulacan rice mills

Ramon Efren Lazaro (The Philippine Star Description: C:\Users\abc\Downloads\Customs padlocks 10 Bulacan rice mills Philstar.com_files\info-icon.png

This content was originally published by The Philippine Star following its editorial guidelines. Philstar.com hosts its content but has no editorial control over it.

) - August 16, 2020 - 12:00am

BALAGTAS, Bulacan , Philippines — Ten rice mills at the Intercity Industrial Estate in Balagtas, Bulacan, a major rice trading center in Luzon, were padlocked by the Bureau of Customs (BOC) in the past two days.

Maj. Neil Cruzado, Balagtas police chief, said BOC agents raided the rice mills after receiving reports on the sale of undocumented rice.

Cruzado clarified that the Balagtas police was not part of the operations.

Skip

Concerned rice millers and rice mill owners told The STAR that BOC agents arrived between 9 p.m. to 10 p.m.

The entrance and exit to the rice mills were closed.  Workers were told that operations are suspended pending investigations to be conducted tomorrow.

A rice mill owner who refused to be identified said they were only told to produce documents. ”Walang sinasabing dahilan,” the owner said.                     

Biggest Food-Producing and Exporting Countries in the World

 Biggest Food-Producing and Exporting Countries in the World

Category:Sport & Fitness
Posted By:AmnaAnees
Posted Date:16 Aug 2020 15:47 hrs

Are excited to know where your favorite food comes from? Well, if yes, then you are just in the right place. We will let you know the biggest food-producing and exporting countries in the world in recent years. You can also check out this list to find out what product your country exports all around the world. So, let's get starte3d!


?    To Coffee Exporting Countries in the World- 2019
The enchanting smell of coffee surely never gives you time to stop and ponder about its origin. However, to get the best coffee available in the world right now, it is surely good to know the top coffee-producing countries.
When talking about the biggest food-producing and exporting countries in the world, coffee is there to sway your mind from the essentials. Here is the list of biggest coffee-producing countries.
•    Brazil
Coffee Production (Metric Tons): 2,592,000
Coffee Production (Pounds): 5,714,381,000
Brazil is the largest coffee producer in the world. And it's not something new, rather Brazil has been on the top for more than 150 years. Brazil cultivates coffee on over 27000 square kilometers of the land. And the major states to grow coffee include Parana, Sao Paulo, and Minas Gerais. These states have the best climatic conditions for the production of high quality coffee beans.
•    Vietnam
Coffee Production (Metric Tons): 1,650,000
Coffee Production (Pounds): 3,637,627,000
Vietnam is the second largest coffee producer in the world. And coffee export has remained the biggest part of the Vietnamese economy. There has been an understandable bump in the course of coffee production and export during the Vietnam War, but things got smooth later on. Vietnam produced 6000 tons of coffee in 1975 and the production rapidly increased and reached almost 2 million now.
•    Colombia
Coffee Production (Metric Tons): 810,000
Coffee Production (Pounds): 1,785,744,000    
Colombia's delicious coffee is renowned all across the globe for its unique taste. However, with the change in climatic conditions from 1980 to 2010, there was a decrease in the production and thus the export of the coffee in Colombia. The temperature and precipitation of the cultivating region increased thus reducing the growth of the coffee plants. And because of that, Colombia cam down to third place instead of its long reign on the second spot.
Here is the list of major coffee producing countries,
•    Indonesia
Coffee Production (Metric Tons): 660,000
Coffee Production (Pounds): 1,455,050,000    

•    Ethiopia
Coffee Production (Metric Tons): 384,000
Coffee Production (Pounds): 846,575,000

•    Honduras
Coffee Production (Metric Tons): 348,000
Coffee Production (Pounds): 767,208,000

•    India
Coffee Production (Metric Tons): 348,000    
Coffee Production (Pounds): 767,208,000

•    Uganda
Coffee Production (Metric Tons): 288,000
Coffee Production (Pounds): 634,931,000

•    Mexico
Coffee Production (Metric Tons): 234,000
Coffee Production (Pounds): 515,881,000

•    Guatemala
Coffee Production (Metric Tons): 204,000
Coffee Production (Pounds): 449,743,000

•    Peru
Coffee Production (Metric Tons): 192,000
Coffee Production (Pounds): 423,287,000


•    Nicaragua
Coffee Production (Metric Tons): 132,000
Coffee Production (Pounds): 291,010,000

•    China(2013/14 est.)
Coffee Production(Metric Tons): 116,820
Coffee Production (Pounds): 257,544,000    

•    Ivory Coast
Coffee Production(Metric Tons):  108,000
Coffee Production (Pounds): 238,099,000

•    Costa Rica
Coffee Production (Metric Tons): 89,520
Coffee Production (Pounds): 197,357,000

?    Most Potato Producing Countries- 2017
For its immense demand around the globe, potato is largely produced on the agricultural lands. The biggest food-producing and exporting countries in the world which have good environmental conditions for the growth of the potato, cultivate potato in huge amounts. Here is the list of top potato producing countries as of the last data available of the year 2017 by the Food and Agriculture Organization of the United Nation. The total production of potatoes in the world in 2017 was 388,190,674 metric tons of which 25.6% was exported from China alone. And the top 5 rice producers fulfill more than 55% of the total potato export.
•    China
Crop Production (Metric Tons): 99,205,580
Potato production is considered one of the top exporting crops in China, and thus the Chinese Government takes all the necessary measures to increase its production in every passing year. Moreover, China's domestic demand has also increased in recent years as well. An increase in the domestic demand o potatoes is thanks to the rapid industrialization of China. With the improvement in the financial status of the people, they start modernizing their lifestyle. And with that comes appeal for the westernized food and that included several dishes of potato. About 10 to 15% of the total potato production of China is used to make processed potato products such as chips, and frozen products.
•    India
Crop Production (Metric Tons): 48,605,000
India has a huge agricultural land and it uses it perfectly. Potato production and export of India widely increased in the 20th century and the country never looked back since. With an increase of more than 850 percent production rate of the potato crops from 1960 to 2000, there was also an increase in domestic appetite towards potato recipes. Just like the case with China, the domestic increase in the demand for potato was also because of the rapid industrialization of the country. Improved economy affected Indian household and thus people changed their living style towards the betterment. In the year 1990, India used to consume about 12 kilograms of potato a year then in the 2000s that number increased dynamically and came up to 25.53 kilograms a year. India now produces more than 48.61 million metric tons of potatoes every year.
Other major countries that produce and export potato in enormous quantities include,
•    Russian Federation
Crop Production (Metric Tons): 29,589,976

•    Ukraine
Crop Production (Metric Tons): 22,208,220

•    United States
Crop Production (Metric Tons): 20,017,350

•    Germany
Crop Production (Metric Tons): 11,720,000

•    Bangladesh
Crop Production (Metric Tons): 10,215,957

•    Poland
Crop Production (Metric Tons): 9,171,733

•    Netherlands
Crop Production (Metric Tons): 7,391,881

•    France
Crop Production (Metric Tons): 7,342,203

•    Belarus
Crop Production (Metric Tons): 6,414,755

•    United Kingdom
Crop Production (Metric Tons): 6,218,000

•    Islamic Republic of Iran
Crop Production (Metric Tons): 5,102,342

•    Turkey
Crop Production (Metric Tons): 4,800,000

•    Peru
Crop Production (Metric Tons): 4,776,294

•    Algeria
Crop Production (Metric Tons): 4,606,403

•    Belgium
Crop Production (Metric Tons): 4,416,665

•    Canada
Crop Production (Metric Tons): 4,410,829

•    Egypt
Crop Production (Metric Tons): 4,325,478

•    Pakistan
Crop Production (Metric Tons): 4,142,399

?    Most Mangoes Producing Countries- 2016
While reading this list of the biggest food-producing and exporting countries in the world, you must be wondering about the inclusion of any fruit. Well, we have chosen the king of all fruits for that matter and that is mango. Mango is one of the most loved fruit all across the globe. This tropical fruit is grown on large trees that reach up to 100 feet high and 12 feet in diameter. It has a single pit and comes in a variety of colors including red, green, orange, and mostly yellow. This yummy fruit is native to Pakistan, India, and Bangladesh. Mughal emperor Akbar who reigned in the 16th century planted more than 100,000 mango trees at a place now named Lakhi Bagh located in India. In addition to these native countries, in the 15th and 16th centuries, the mango was traded and introduced to Africa, the Philippines, and Brazil. Now, you can taste the flavors of mango all across the globe thanks to the following exporters of the fruit.
•    India
Mango Production (Tons): 18,779,000
With the export of more than 18 million tons of mangoes a year, India is top on the list of biggest producers and exporters of the mango. India is solely responsible for about 50% of the total worldwide export of mango. Major states of India where mango is mainly produced include Andhra Pradesh, Bihar, Maharashtra, Orissa, Gujrat, and Karnataka. Along with these major states, other states of India also produce mango, but not in such large quantities. In total, India has dedicated more than 2,309,000 acres of land for the production of mango only.
•    China
Mango Production (Tons): 4,771,038
China is becoming the major producer and exporter of several foods in recent years. That is because of the drastic and dynamic Government policies in the production and trade departments. And this is the main reason that has put China on the second spot for producing mangoes with the production of about 4.77 million tons of mango every year. Although mango is being cultivated on the soil of China for centuries China started producing mangoes significantly back in the 1960s and the quantity is rising with each passing year. The main regions of China that produce mangoes in handsome amounts include Hainan Province,  Guangxi Autonomous Region, Guangdong Province, Yunnan Province, Sichuan Provinces, and Fujian Province. China has dedicated more than 120,000 hectares of land for the production of mangoes as per the states generated in 2008. 
•    Thailand
Mango Production (Tons): 3,432,129
Thailand comes on the third spot after India and China with the production of more than 3.4 million tons of mango production a year. The main portion of this production is sold freshly in the domestic markets. On the other hand for the export, Thailand mostly sends processe3d mango in canned, dried, or frozen form. Fresh fruit is also exported. Thailand's fresh mangoes are popular in South Korea, Malaysia, China, Singapore, and Japan. Thailand cultivates mango trees in more than 753,671 acres of the land. And the country has gained more than 50 million USD with mango's export.
The following are the names and production amount of the major mango producing countries.
•    Mexico
Mango Production (Tons): 2,197,313

•    Indonesia
Mango Production (Tons): 2,184,399

•    Pakistan
Mango Production (Tons): 1,606,091

•    Brazil
Mango Production (Tons): 1,417,149

•    Egypt
Mango Production (Tons): 1,277,008

•    Bangladesh
Mango Production (Tons): 1,161,685

•    Nigeria
Mango Production (Tons): 917,617

•    Philippines
Mango Production (Tons): 827,075

•    Sudan
Mango Production (Tons): 785,940

•    Kenya
Mango Production (Tons): 734,658

•    Vietnam
Mango Production (Tons): 725,306

•    Haiti
Mango Production (Tons): 670,878

•    Tanzania
Mango Production (Tons): 427,586

•    Cuba
Mango Production (Tons): 420,191

•    Yemen
Mango Production (Tons): 405,774

•    Peru
Mango Production (Tons): 377,382

•    Colombia
Mango Production (Tons): 314,034

?    Most Milk Producing Countries- 2019
Milk is one of the most important food for health and that is why it is high in demand all across the globe. Both, milk's production and export is raising in the world with each passing year. Among the biggest food-producing and exporting countries in the world, specifically speaking about the ilk, the European Union was the leading exporter of the cow's milk in the world for the year 2019. In 2019, 28 countries of the EU produced about 155.3 million metric tons of milk in total. The United States reserved the second spot with the production of more than 99 million metric tons of milk. The following are the major milk-producing countries in the year 2019.
•    European Union -28
Milk Production in Million Metric Tons: 155.3
A total of 28 courtiers of the European Union produced the major portion of the world's milk with a collective total of 155.3 million metric tons. However, if you are wondering which one is the largest milk-producing country then the answer would be the United States.
•    United States
Milk Production in Million Metric Tons: 99.16
The United States is among the top producers of cow milk as it has massively increased milk production by 1.76 liters a cow. Major states of the United States that are renowned for producing cow milk are California, New York, Idaho, Pennsylvania, and Wisconsin. Large dairy farms of the country have the capacity of inhabiting over 15,000 cows each. On the other hand, small farms have the capacity of inhabiting as less as 30 cows as well. The United States exports cow milk to China, Canada, Saudi Arabia, several countries of Southeast Asia, and Taiwan. In addition to the exports, the domestic demand of the United States for the cow's milk is also very high.
•    India
Milk Production in Million Metric Tons: 91.3
India is among the major or the biggest producers of the buffalo milk and cow's milk. India has made its mark on the world map with massive milk production in 2014 and 2015 and is now producing 9.5% of the total cow's milk production worldwide. Milk production in India is not yet done in an organized manner as more than 80% of the milk produced in  India comes from the small sector. Uttar Pradesh, Andhra Pradesh, and Punjab are the major milk-producing regions of India. India export cow milk to Nepal, Bhutan, Pakistan, Bangladesh, Afghanistan, and the United Arab Emirates.
Other major countries that produce cow's milk in large quantities include, 
•    Russia
Milk Production in Million Metric Tons: 30.56
•    China
Milk Production in Million Metric Tons: 31
•    Brazil
Milk Production in Million Metric Tons: 24.45
•    New Zealand
Milk Production in Million Metric Tons: 21.86

•    Mexico
Milk Production in Million Metric Tons: 12.62

•    Argentina
Milk Production in Million Metric Tons: 10.64

•    Canada
Milk Production in Million Metric Tons: 9.95

•    Ukraine
Milk Production in Million Metric Tons: 9.90

•    Australia
Milk Production in Million Metric Tons: 8.75

•    Belarus
Milk Production in Million Metric Tons: 7.39

•    Japan
Milk Production in Million Metric Tons: 7.31

•    South Korea
Milk Production in Million Metric Tons: 2.04

•    Taiwan
Milk Production in Million Metric Tons: 0.42

?    To Rice Exporting Countries in the World-  2018-2019
Rice is one of the most eaten food in the world. And for that, it is largely produced and one of the biggest crops to be exported all around the world. Because of its high demand, numerous varieties, and use all around the world, rice never goes low in demand.
However, the total percentage of rice exports of the world was estimated to be 21.9 billion USD in the year 2019 which was 5.9% less as compared to the year 2015, as in 2015 the total estimated export of the rice worldwide was 23.2 billion USD. Year after year, the global production and export of the rice decreased.
Among the biggest food-producing and exporting countries in the world, major countries having huge cultivation land produce and export rice. Here is the list of biggest exporters of rice in the world
•    India
Total export estimated: 7.1 billion USD
Percentage of total rice exports: 32.5%
India's soil is ideal for rice production. According to the data collected in 2018 and 2019 years, India was the top country in exporting rice all around the globe. With the availability of vast areas of agricultural land, appropriate seasonal changes, and rainfall, all make India one of the best land for the cultivation of rice. India fulfills more than 30% of the total export of rice in the world.
•    Thailand
Total export estimated: 4.2 billion USD
Percentage of total rice exports: 19.2%
Thailand is another great country that has enormous land for the cultivation of rice. With the availability of 9.2 million hectares of land and amazing environmental conditions, Thailand is among the top producers and exporters of the rice. Thailand's Jasmine rice is double in the price as compared to other Jasmine rice exported in the international market.
•    United States
Total export estimated: 1.9 billion USD
Percentage of total rice exports: 8.6%
Although the United States has different environmental conditions than South Asian and warm countries, because of the huge cultivation land and use of modern scientific methods, it is among the biggest food-producing and exporting countries in the world.
Here is the list of other top countries in the rice-producing category.
•    Vietnam
Total export estimated: 1.4 billion USD
Percentage of total rice exports: 6.6%

•    Pakistan
Total export estimated: 1.2 billion USD
Percentage of total rice exports: 5.6%

•    China
Total export estimated: 1.1 billion USD
Percentage of total rice exports: 4.8%

•    Italy
Total export estimated: 624.3 million USD
Percentage of total rice exports: 2.9%

•    Myanmar (Burma)
Total export estimated: 579 million USD
Percentage of total rice exports: 2.6%

•    Cambodia
Total export estimated: 430.6 million USD
Percentage of total rice exports: 2%

•    Uruguay
Total export estimated: 375.8 million USD
Percentage of total rice exports: 1.7%

•    Brazil
Total export estimated: 367.6 million USD
Percentage of total rice exports: 1.7%

•    Netherlands
Total export estimated: 307.4 million USD
Percentage of total rice exports: 1.4%

•    Belgium
Total export estimated: 271.4 million USD
Percentage of total rice exports: 1.2%

•    Paraguay
Total export estimated: 226.7 million USD
Percentage of total rice exports: 1%

•    Spain
Total export estimated: 207 million USD
Percentage of total rice exports: 0.9%

•    Argentina
Total export estimated: 185.4 million USD

•    Australia
Total export estimated: 139.7 million USD

•    Guyana
Total export estimated: 91.3 million USD

•    United Arab Emirates
Total export estimated: 78.7 million USD

•    Russia
Total export estimated: 78.0 million USD
Among these rice exporting countries, the fastest rice-growing countries since 2015 are China, Netherlands, Paraguay, and Cambodia with an increase of 296%, 75.7%, 74.6%, and 51.1% each. Moreover, the countries which produced less rice than previous years include Vietnam, Pakistan, Thailand, the United States, and Myanmar with a decrease of 48.6%, 36.9%, 7.7%, 6.3%, and 5.4%.

There you go! These biggest food-producing and exporting countries in the world are basically Fulfilling the basic food consumption of the world. To decrease hunger, all of us need to adopt healthy eating habits, avoid wastage of food, try to grow vegetables and fruits in your kitchen garden, and also be mindful of the needs of others. These are all the necessary steps that we must do on the individual level. Now coming to a nationwide change, there is an utmost need to reduce the urbanization process, especially in developing countries. Because most housing schemes or multinational companies are built on the farming land. In a nutshell, it is our duty as the inhabitants of the mother earth to protect our nature and be kind to one another.

Europe Rice Market Growth Forecast 2020 to 2024 | Trending Opportunities, Development Factors, Industry Players, Business Size


Europe Rice Market Growth Forecast 2020 to 2024 | Trending Opportunities, Development Factors, Industry Players, Business Size by Share

Europe Rice

The “Europe Rice Market” report 2020 provides information for market players, stakeholders, investors, and business strategists to achieve a leading position in the market. It maintains the record of Unusual growth strategies adopted by various companies that are creating new standards for competition in the global Europe Rice market. Businesses around the world are aiming at increasing their profit margin and establishing a stronghold in the global market. The impact of the prevailing regulatory scenario on both regional and worldwide Europe Rice market is provided in detail in the report.

Europe Rice Market Covers the Following Key Players:

  • Player 1
  • player 2
  • player 3
  • Get a Sample Copy of the Report – https://www.industryresearch.co/enquiry/request-sample/14245088  

    Market Overview:

  • The rice crop is grown in around 27 countries of the European region in about 450,000 ha of land. The region produces around 70% of the total rice consumed and the average annual production stands at 3.1 million tons. Per capita, annual consumption is read at 3.5-5 kg in non-rice growing countries and 6-18 kg in Southern Europe. Italy and Spain are the major rice growing countries, accounting for 80% of the total EU production. Other rice growing areas are Greece, Portugal, France, Russia, Romania, Bulgaria, and Hungary. The region depends on import for specialty long grain indica rice such as basmati and jasmine from India and Pakistan. Europe imported around 0.66 million tons in 2015-16 from Cambodia (24%), India (23%), Thailand (18%), Guyana (11%), and Pakistan (10%). France, Italy, Netherlands, Denmark, and the United Kingdom are the major rice trading countries in the region.

    Scope of the Report:

    European rice market can be sub-divided into two major rice varieties, Japonica rice, and Indica rice. Japonica rice is the traditional European rice, representing around 75% of the European rice production, with Europe being self-sufficient and thus is even a net exporter. On the other hand, Indica rice is known as traditional Asian rice, representing around 25% of European rice production.

    For More Information or Query or Customization Before Buying, Visit at – https://www.industryresearch.co/enquiry/pre-order-enquiry/14245088

    Key Market Trends:

    Strong Demand In North-western Europe

    The majority of European import of rice accounts for north-western Europe, with the United Kingdom, France, and Germany as the largest importers. France and the Netherlands are the largest importers of rice from developing countries. The Netherlands has a strong marine transportation system that forms an important entry point for rice into Europe from various developing countries. Important rice varieties imported by Europe are long-grain Indica rice and aromatic varieties (basmati, jasmine, etc.). United Kingdom is the leading importer of basmati rice, which is largely sourced from India. India, Pakistan, Thailand, and Cambodia are some of the major exporters of rice to Europe.

    Italy- The Largest Rice Consuming Country in the Europe

    The consumption of rice in Italy was valued at USD 937,893.7 thousand in 2018, witnessing a CAGR of 4.8%, during the forecast period. Risotto is one of the most representative and widely eaten Italian dishes, and its demand has been rising rapidly among Italian consumers. Italian consumers perceive rice and grains to be healthier than pasta. Owing to growing health consciousness among the Italian consumers, they are cutting back and limiting the amount of pasta in their diet, while shifting toward the consumption of healthier grains, including rice. Owing to the changing consumer preferences and changing lifestyles, local companies in the country are consistently involved in innovation that constantly adapts to the needs of the modern consumer. For instance, the Italian company, Riso Bello added new ready-to-eat risottos in its product range, to satisfy the market demand for high-quality, easy-to-cook products.

    Report Highlights:

    • The report provides a detailed analysis on current and future market trends to identify the investment opportunities
    • Market forecasts till 2024, using estimated market values as the base numbers
    • Key market trends across the business segments, Regions and Countries
    • Key developments and strategies observed in the market
    • Market Dynamics such as Drivers, Restraints, Opportunities and other trends
    • In-depth company profiles of key players and upcoming prominent players
    • Growth prospects among the emerging nations through 2024
    • Europe Rice Market opportunities and recommendations for new investments

    Purchase this Report (Price 3250 USD for single-user license) – https://www.industryresearch.co/purchase/14245088

    Detailed TOC of Europe Rice Market Report 2019-2024:

    1 INTRODUCTION
    1.1 Study Deliverables
    1.2 Study Assumptions
    1.3 Scope of the Study

    2 RESEARCH METHODOLOGY

    3 EXECUTIVE SUMMARY

    4 MARKET DYNAMICS
    4.1 Market Overview
    4.2 Market Drivers
    4.3 Market Restraints
    4.4 Value Chain Analysis
    4.4.1 Value Chain Overview
    4.4.2 Price Markups in the Value Chain
    4.4.3 Stakeholders in the Value Chain
    4.5 Variety & Grade Analysis

    5 MARKET SEGMENTATION
    5.1 Geography
    5.1.1 Russia
    5.1.1.1 Production Analysis
    5.1.1.2 Consumption Analysis & Market Value
    5.1.1.3 Import Market Analysis (Volume & Value)
    5.1.1.4 Export Market Analysis (Volume & Value)
    5.1.1.5 Price Trend Analsysis
    5.1.2 United Kingdom
    5.1.2.1 Production Analysis
    5.1.2.2 Consumption Analysis & Market Value
    5.1.2.3 Import Market Analysis (Volume & Value)
    5.1.2.4 Export Market Analysis (Volume & Value)
    5.1.2.5 Price Trend Analysis
    5.1.3 France
    5.1.3.1 Production Analysis
    5.1.3.2 Consumption Analysis & Market Value
    5.1.3.3 Import Market Analysis (Volume & Value)
    5.1.3.4 Export Market Analysis (Volume & Value)
    5.1.3.5 Price Trend Analysis
    5.1.4 Italy
    5.1.4.1 Production Analysis
    5.1.4.2 Consumption Analysis & Market Value
    5.1.4.3 Import Market Analysis (Volume & Value)
    5.1.4.4 Export Market Analysis (Volume & Value)
    5.1.4.5 Price Trend Analysis
    5.1.5 Germany
    5.1.5.1 Production Analysis
    5.1.5.2 Consumption Analysis and Market Value
    5.1.5.3 Import Market Analysis (Volume & Value)
    5.1.5.4 Export Market Analysis (Volume & Value)
    5.1.5.5 Price Trend Analysis

    6 MARKET OPPORTUNITIES AND FUTURE TRENDS

    Contact Us:

    Name: Ajay More

    Phone: US +14242530807/ UK +44 20 3239 8187

    Email: sales@industryresearch.co

    Our Other Reports:

    Recycled Polymers Market Size Forecast Analysis by Global Opportunities 2020: Development Status, Organization Share, Market Components, and Regional Outlook till 2026

    Magnetic Heating Mixer Market Growth Rate and Size Analysis 2020 | Global Industry Share, Demand and Future Scope, Business Prospect, and Opportunities Forecast till 2026

    SMD Ceramic Packaging Market Size 2020 Trend, Latest Industry News with Share, Growth Factors, Top Key Players, Industry Demand, Share, Business Statistics and Forecast to 2026

    Organic Acid Products Market Share and Forecast by 2020 to 2026 | Top Key Players Analysis Covers Regions with Growth Value, Comprehensive Development Strategy, Global Size with Revenue and COVID-19 Impact

    Bicycle Trailers Market Future Trends, Growth Factors 2020: Global Opportunities by Leading Countries, Manufacturing Size and Share, Industry Segments by Types and Applications Forecast to 2026

    Flight Planning Market Size Forecast Report 2020 Growth Rate Analysis by Leading Players with COVID-19 Impact, Top Countries, Upcoming Trends, and Business Revenue by 2026

  • https://scientect.com/uncategorized/100864/europe-rice-market-growth-forecast-2020-to-2024-trending-opportunities-development-factors-industry-players-business-size-by-share/

  • Leave a Reply

    PLT Health launches water soluble Boswellia ingredient for sports nutrition market


    PLT Health launches water soluble Boswellia ingredient for sports nutrition market

    June 22, 2020

    PLT Health Solutions Inc., in partnership with Laila Nutraceuticals, is launching a new joint health and muscle recovery ingredient marketed to the active and sports nutrition market, called Dynaleve Muscle+Joint Formula. 

    sports nutrition
    Photo © iStockphoto.com

    PLT Health Solutions Inc. (Morristown, NJ), in partnership with Laila Nutraceuticals, is launching a new joint health and muscle recovery ingredient marketed to the active and sports nutrition market, called Dynaleve Muscle+Joint Formula. The ingredient contains a low dose of Boswellia serrata, delivered in a neutral-tasting, water soluble form.

    In an unpublished clinical study, Dynaleve was evaluated using the Delayed Onset Muscle Soreness model. In the trial, 50 recreationally active men were given either 60 mg of Dynaleve or placebo for 10 day, with eccentric exercise intervention at day 7. Results showed that, compared to placebo, daily supplementation with the ingredient reduced muscle soreness by 47%, and knee soreness by 31%. Full recovery of strength was achieved by 96% of subjects in the Dynaleve group on day 3, 2.5 times more than subjects in the placebo group. Subjects taking Dynaleve also saw improvements in biomarkers related to inflammation, muscle damage, and connective tissues damage.

    “Dynaleve is such a novel and powerful ingredient in that it that supports both muscle and joint comfort. The new study points to an ingredient that can change the landscape of the active and sports nutrition market by offering a comprehensive, low dose solution to post-exercise recovery, while promoting the ability to perform at a higher level with less recovery time,” said Seth Flowerman, president and CEO of PLT Health Solutions, in a press release. “At the same time, this study highlights the potential for Dynaleve to help people feel better faster in their day to day lives – things like climbing stairs or walking with less stiffness can be made easier.”

    “Dynaleve was specifically developed as a low-dose, neutral-tasting, and soluble solution for ease of incorporation into a broad range of applications and delivery systems,” added Flowerman. “This solution represents a significant invention in its own right as it overcomes the traditional challenges of incorporating Boswellia serrata into organoleptically sensitive and water-soluble formulations.”


    OptiBiotix launches WellBiome for digestive, cardiovascular, metabolic health

    August 14, 2020

    UK-based OptiBiotix Health PLC launched WellBiome, a functional fiber and mineral blend, containing fructooligosaccharides, glucomanan, and chromium.

    digestive
    Photo © AdobeStock.com/BillionPhotos.com

    UK-based OptiBiotix Health PLC launched WellBiome, a functional fiber and mineral blend, containing fructooligosaccharides, glucomanan, and chromium, formulated to support the growth of beneficial bacteria and improve overall wellbeing. It was developed by UK universities and key opinion leaders on the gut microbiome and functional food ingredients, and it is gluten- and lactose-free.

    “We are pleased to unveil our new revolutionary ingredient that joins the OptiBiotix ingredients portfolio,” said Frederic Narbel, DBA, managing director of functional fibers at OptiBiotix, in a press release. “As consumer awareness of the gut microbiome increases, products that contain functional fibers that support health and wellbeing are becoming increasingly popular. With the microbiome modulating WellBiome, our partners can now extend their reach into the exciting health and wellbeing market with a science-backed offering.”

    WellBiome’s patented formulation has shown its efficacy in controlled human studies. The prebiotic helps to maintain a healthy digestive system and supports regular bowel habits by significantly increasing essential bacteria, including the Bifidobacterium, Bacteroides, and Christensenella strains due to its high soluble fiber content (94%). In addition, scientific studies have demonstrated WellBiome can regulate glycemic response to support metabolic health and significantly reduce systolic blood pressure. It also supports several European Food Safety Authority (EFSA) health claims, including the use of chromium which contributes to the maintenance of normal blood glucose levels and glucomannan, which reduces blood cholesterol.

    “The Health and Wellness industry is estimated to be worth $4.2 trillion in 2019, with the digestive health segment accounting for $60 billion,” said Narbel. “For OptiBiotix, the development of WellBiome is a direct response to the trends that are dominating the industry today. As a leading life sciences company that excels in delivering science-backed ingredients, we are helping to combat the health challenges of today, tomorrow and the near future. WellBiome is a major part of this journey and will help play a key role in the livelihoods of consumers by improving digestive, heart and metabolic health.”


    Blueberries may support muscle growth, repair in women, says recent study

    August 14, 2020

    A new research study funded by the U.S. Highbush Blueberry Council investigated how subjects consuming a diet enriched with blueberries affects the cells responsible for muscle growth and repair.

    blueberries
    Photo © iStockphoto.com/Kativ

    A new research study funded by the U.S. Highbush Blueberry Council (USHBC; Folsom, CA) and published in the Journal of Nutrition investigated how subjects consuming a diet enriched with blueberries affects the cells responsible for muscle growth and repair—human muscle progenitor cell (hMPC).

    The six-week study included 22 women, 12 aged 25-40 and 10 aged 60-75. Participants consumed the equivalent of 1.75 cups of fresh blueberries/day, given as freeze-dried blueberries along with their regular diet. They were also asked to avoid other foods rich in polyphenols and anthocyanins. 

    After six weeks, the results showed the blueberry-enriched serum obtained from the women aged 25-40 increased human muscle progenitor cell numbers in culture. There was also a trend toward a lower percentage of dead human muscle progenitor cells, suggesting resistance to oxidative stress, as well as increased oxygen consumption of the cells. There were no beneficial effects seen in the muscle progenitor cells treated with serum from participants aged 60-75.

    “The consequences associated with the deterioration of skeletal muscle are a loss of mobility, decreased quality of life, and ultimately, loss of independence,” said Anna Thalacker-Mercer, PhD, the study’s lead investigator, in a press release. “Currently, research on dietary interventions to support skeletal muscle regeneration in humans is limited. This preliminary study of muscle progenitor cell function paves the way for future studies to develop clinical interventions. While the results cannot be generalized to all populations, this study is an important step in translating findings from cell culture and rodent studies to a potential dietary therapy for improving muscle regeneration after injury and during the aging process.”

    USHBC had no role in study design, data collection, data analysis, data interpretation, or writing of the study. 

    Reference

    1. Blum JE et al. “Consumption of a Blueberry-Enriched Diet by Women for 6 Weeks Alters Determinants of Human Muscle Progenitor Cell Function” Journal of Nutrition, Published online ahead of print on July 17, 2020

    Ketogenic product trends in 2020

    August 14, 2020

    How are keto manufacturers keeping the category fresh for keto followers?

    Ketogenic product trends in 2020
    Photo © AdobeStock.com/anaumenko

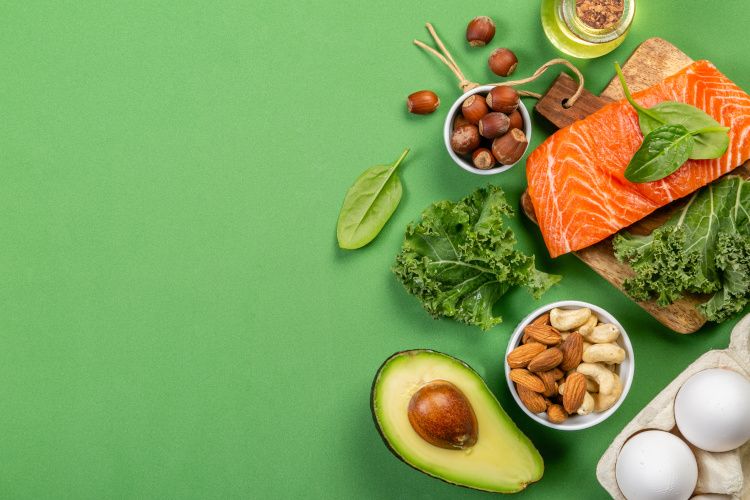
    The popularity of the ketogenic diet continues to grow as more consumers learn of it. Market research from The Insight Partners predicts that the keto market will see a 5.5% CAGR through 2027, with snacks and beverages leading the ketogenic products category.1

    While the rise of keto-friendly to-go products may have contributed to the myth that keto is just a fad, according to Keto Primo (Temecula, CA) co-founders Diana Alanis and Emily Adams, the keto trend is only growing. Over the last two years, a number of creative keto products have hit the market that are making keto simpler for consumers. Here are some of the most innovative product trends in keto today.

    Keto Enters the Convenience & Condiments Markets

    Several brands are introducing functional foods that help to promote ketosis or that adhere to the requirements of the ketogenic diet, and many of these functional foods are in the form of convenience products and condiments. Alanis and Adams said in a joint statement that busy American families are looking for healthy meal prep solutions that don’t require a significant time investment.

    Ketogenic product trends in 2020
    Photo from Keto Primo

    “Preparing food should be simple. Nearly every American restaurant has a bottle of ketchup on the table, and nearly every children’s menu has chicken nuggets with BBQ sauce for dipping. So instead of serving our families a side of corn syrup with every meal, [ketogenic condiments] provide comparable taste while also containing healthy ingredients.”

    Condiments, they say, are also an ideal vertical for keto products because products like barbecue sauce are a fast and easy way to add flavor to meats and vegetables. Keto Primo aims to make the ketogenic diet more accessible and more convenient. To that end, Keto Primo is also working to educate consumers on the keto lifestyle through their recently launched Keto Revolution podcast.

    Ketogenic Supplements Fight the Keto Flu

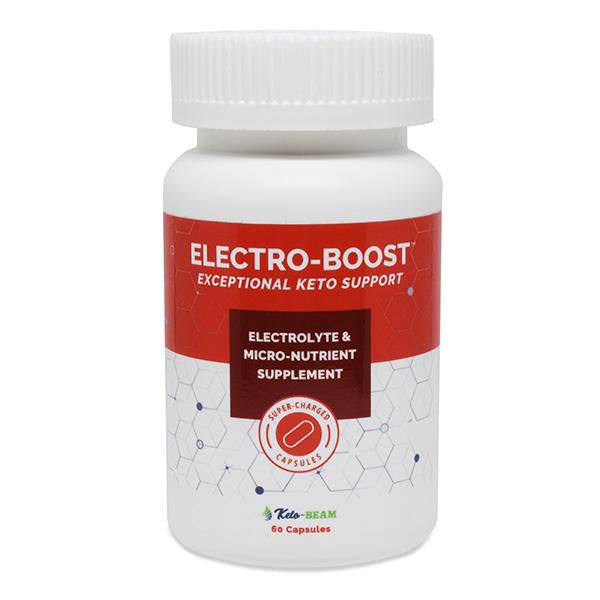
    There are several reasons why keto dieters take keto supplements, and brands are diversifying both product formats and product claims in an effort to appeal to a broader segment of the keto market. Terms like keto flu are becoming increasingly common in marketing claims for keto supplements. Caroline Alan, co-founder of electrolyte supplement brand Keto-BEAM (Portland, OR), says that brands are changing both their marketing language and their product formats where ketogenic supplements are concerned.

    Ketogenic product trends in 2020
    Photo from Keto-BEAM

    “The term keto flu speaks to the experience of people who adhere to the keto way of life,” Alan says. “Many keto flu symptoms are actually a result of micronutrient depletion, not electrolyte depletion. Liquid supplements are trending up because they have high bioavailability. Pills are trending down because they have very low bioavailability—only about 10% to 12%.”

    Consumers Prefer Powdered Exogenous Ketones

    Vanessa Pavey, Education Scientist at Life Extension (Fort Lauderdale, FL), says that exogenous ketones commonly come in a powdered format because powder is the preferred delivery method of athletes and biohackers. Beta-hydroxybutyrate, in particular, for instance, commonly comes powdered.

    “Ketones are an efficient energy source for highly metabolic tissue like the brain and the muscles,” Pavey says. “For long-distance cyclists and marathon runners, who need sustained energy during a workout, a powder is easy to mix into a water bottle and sip throughout the session.”

    Ketogenic product trends in 2020
    Photo from Life Extension

    Pavey says that she expects powdered keto supplements to incorporate more functional ingredients as they evolve. For instance, she cites the theoretical example of an exogenous ketone supplement that helps keto dieters maintain the ideal fat-to-carbohydrate ratio.

    “It is very likely that future research will continue to show the brain and body benefits of using ketones for energy. Powder-based supplements that provide endogenous ketones combined with nutrients that assist endogenous ketone production will perform well in the keto product category. Mango extract and resistant starch, for instance, provide such benefits.”

    Keto Products Ready for Mainstream

    The growing diversification of the keto products market indicates that mainstream consumers are increasingly accepting of the keto diet and lifestyle. Google Trends data indicates that in the United States, search traffic for the term keto has grown by 850% over the last four years.2 As consumers continue to become more health conscious and look for ways to cut back on sugar and carbs, keto will only grow, and there will be more opportunities for innovative and creative keto products. Brands that can come up with creative keto-friendly alternatives to consumers’ existing preferred foods will be well positioned for the future growth of the keto market.

    References

    1. The Insight Partners. “Ketogenic Diet Market to 2027 – Global Analysis and Forecasts by Product Type (Supplements, Beverages, Snacks, Dairy, and Others); Distribution Channel (Hypermarket & Supermarket, Specialty Stores, Convenience Stores, and Others); and Geography.” Published online July 2019. Accessed at: https://www.theinsightpartners.com/reports/ketogenic-diet-food-market
    2. Cassity J. “The Keto Market: New Statistics on Market Size, Value and Keto Product Growth.” Kerry Digest (Kerry website). Published online January 27, 2020. Accessed at: https://www.kerry.com/insights/kerrydigest/2020/keto-market
    download issueDownload Issue : Nutritional Outlook Vol. 23 No. 6

    Arla Foods launches organic micellar casein isolate protein ingredient, MicelPure Organic

    August 14, 2020

    Arla Foods Ingredients launched MicelPure Organic, an organic micellar casein isolate with a minimum of 87% native protein.

    protein
    Image courtesy of Arla Foods

    Arla Foods Ingredients (Basking Ridge, NJ) launched MicelPure Organic, an organic micellar casein isolate with a minimum of 87% native protein and extracted from milk using gentle processing without the addition of acids. It is suitable for functional health foods and active-nutrition applications, low in lactose and fat, heat-stable, and neutral tasting.

    “When consumers hear organic, they think healthy, sustainable, and wholesome,” said Barbara Jensen, business development manager at Arla Foods Ingredients, in a press release. “However, a shortage of natural, organic protein ingredients has prevented many manufacturers from entering this market. MicelPure Organic fills the gap, allowing companies to extend their portfolios with products that are both organic and packed with high-quality protein.”

    Joe Katterfield, business development manager for sports nutrition and health foods at Arla Foods Ingredients, said in a press release, “Protein’s benefits for muscle growth, recovery, and weight management have driven consumer demand in a range of categories. But while the high-protein trend is definitely here to stay, manufacturers also have to meet many other needs. MicelPure combines high protein levels and functionality with an offer of healthy wholesomeness that increases appeal.”

    MicelPure Organic can be used in a number of food applications cooking-stable cheeses, yogurt, ice cream, pudding, as well as health and performance applications such as ready-to-drink high-protein beverages and powder shakes.


    Australia, New Zealand publish digestive claims for GanedenBC30

    August 13, 2020

    GanedenBC30, a branded probiotic used in multiple food and beverage categories, was approved in Australian and New Zealand for a range of digestive-health claims supported by a wealth of scientific evidence.

    claims
    Photo © iStockphoto.com/rzdeb

    GanedenBC30, a branded probiotic used in multiple food and beverage categories, was approved in Australian and New Zealand for a range of digestive-health claims supported by a wealth of scientific evidence.

    The FSANZ (Food Standards Australia New Zealand) Food Standards code sets out the requirements for making a general-level health claim. Companies that want to make a claim can go through a systematic review of evidence of a causal food-health relationship. With 25 published papers supporting the efficacy of GanedenBC30’s benefits for digestive health, the ingredient’s manufacturers, Kerry (Beloit, WI), was able to conduct a comprehensive review in line with the ANZ Food Standards code.

    The claims include “aids digestive health”, “supports digestive health”, and “boosts digestive health”. In addition to the volume of evidence supporting its benefits, as a spore-forming probiotic, GanedenBC30 remains viable through shelf life and the low pH of stomach acid, as well as processing conditions like heat, shear, and HPP pasteurization.

    “As in the rest of the world, demand for probiotic products in Australia has soared in recent years,” said John Quilter, vice president and general manager for GanedenBC30, in a press release. “The door is now open for manufacturers to use messaging highlighting the many benefits of GanedenBC30. In addition to being backed by a wealth of scientific evidence, it’s a highly resilient probiotic strain, opening up opportunities for innovation in a range of food and beverage categories.”

    “Consumers are increasingly skeptical and rightly asking questions about the effectiveness of functional ingredients such as probiotics,” Quilter said. “The best way to respond is by clearly communicating benefits and the research supporting them. Scientific substantiation helps manufacturers and consumers alike understand the value of ingredients and choose products that can really support health.”


    AHPA supports USDA’s proposal to allow pullulan in products labeled organic

    August 13, 2020

    AHPA supports the addition of pullulan to the National List at 7 CFR § 205.605 as a nonagricultural (nonorganic) ingredient that can be used only in tablets and capsules for dietary supplements labeled, “Made with organic (specified ingredients or food group(s)).”

    pullulan
    Photo © istockphoto.com/LightScribe

    The American Herbal Products Association (AHPA; Washington, D.C.) sent a letter to the U.S. Department of Agriculture's (USDA's) Agricultural Marketing Service (AMS) to support adding pullulan to the National List at 7 CFR § 205.605 as a nonagricultural (nonorganic) ingredient that can be used only in tablets and capsules for dietary supplements labeled, “Made with organic (specified ingredients or food group(s)).” AHPA membership includes numerous companies that grow herbal crops or market herbal products certified as organic under USDA’s National Organic Program (NOP), including capsuled dietary supplements that include pullulan as an ingredient.

    On June 8, 2020, USDA’s AMS issued a proposed rule to amend the National List of Allowed and Prohibited Substances within USDA’s organic regulations by adding several substances to implement recommendations submitted to the Secretary of Agriculture by the National Organic Standards Board (NOSB), which included the proposal to add pullulan. AHPA explains in its comments that pullulan has a history of use in encapsulated supplement products classified as organic by the NOP because pullulan was previously classified as agricultural. This was until December of 2016, when pullulan was classified as a nonagricultural substance. 

    Pullulan’s inclusion to the National List would maintain the status quo by allowing dietary supplements in tablets and capsules that include pullulan to continue to be labeled, “Made with organic (specified ingredients or food group(s)).” Pullulan is currently a key ingredient in non-animal-sourced capsules, as a vegetarian alternative to gelatin.

    “The addition of pullulan to the National List at 7 CFR § 205.605 will ensure that the option of vegetarian herbal supplement capsules continues to be available, thus supporting both the farmers who grow organic herbs and the consumers who choose to include supplements in this form in their personal health care choices,” said AHPA in its letter.

    AHPA also expressed support for comments submitted by the Organic Trade Association (OTA), which go into greater detail on the issue of adding pullulan to the National List.


    Poverty associated with inadequate intakes of calcium and vitamin D, says recent study

    August 13, 2020

    A recent study conducted by Pharmavite LLC shows that older adults living below the poverty line have inadequate intakes of calcium and vitamin D, putting them at greater risk of osteoporosis.

    osteoporosis
    Photo © iStockphoto.com/monkeybusinessimages

    A recent study1 conducted by Pharmavite LLC (West Hills, CA) shows that older adults living below the poverty line have inadequate intakes of calcium and vitamin D, putting them at greater risk of osteoporosis. Researchers performed a cross-sectional analysis of United States population using National Health and Nutrition Examination Survey (NHANES) data from 2007–2010 and 2013–2014 for older US adults (n = 3,901 participants, 50 years old and older).

    According to the study, based on current U.S. population estimates, 14 million Americans age 50 and older are expected to have suffered from probable osteoporosis in 2019, representing about 10% of the total Americans in this age group. Within this group, women are more likely to be affected (16.2%) compared to men (4.6%). Looking at these figures from a nutrient intake perspective, the researchers estimate that 60% of the cohort have inadequate calcium intakes (72.4% of females; 51.4% of males) and 36.7% (24.1% of females; 39.7% of males) of this cohort have inadequate vitamin D intake. Of Americans over the age of 50 and older, it’s estimated that only 30% supplement with calcium and vitamin D.

    Among Americans ages 50 and older, an estimate 23% belong to households with an annual income below $20,000. Researchers determined that 68% (74.3% of females; 58.9% of males) of this income bracket have inadequate calcium intake level, and 43% (39.4% of females; 46.7% of males) have inadequate vitamin D intake. Household income is also strongly associated with relative risk of osteoporosis. Adults 50 years of age or older belonging to a household with a household income less than $20,000 have a 60% relative risk of osteoporosis, compared to high income brackets. When considering the combined effect of household income and nutrient intake, researchers determined that the relative risk of osteoporosis was greater by 45% for those with inadequate intakes of calcium, by 41.1% for those with inadequate intakes of vitamin D.

    When analyzing this data by ethnicity, the effect of poverty levels on risk of osteoporosis had the greatest impact on Mexican Americans, specifically females, and non-Hispanic whites of both genders. In addition, non-Hispanic black men with lower incomes are twice as likely to develop osteoporosis compared to higher income counterparts, despite a lower risk of osteoporosis among non-Hispanic black people overall. While food insecurity does play a significant role on inadequate intakes of calcium and vitamin D, it does not appear to play a large role in relative risk of osteoporosis unless ethnicity is taken into consideration. Non-Hispanic whites reporting food insecurity have a 68.1% greater relative risk of osteoporosis compared to food secure counterparts, and food-insecure Mexican Americans have a 26% greater relative risk of osteoporosis.

    “This study continues to demonstrate how prevalent nutrient deficiency is among the U.S. population, and even more so, among lower income individuals and those with food insecurities,” said Susan Hazels Mitmesser, PhD, vice president of science and technology at Pharmavite, in a press release. “Improving the consumption of nutrient-rich and fortified foods among individuals that live in poverty can help to decrease their chances of developing osteoporosis. Additionally, dietary supplements can play a critical role in helping any underserved population meet their nutrition needs —including making supplements readily available through programs like SNAP, for example. Our research demonstrates that participants with SNAP benefits and more access to food, have fewer nutrient inadequacies which helps them meet their nutrition needs.”

    Reference

    1. Marshall K et al. “Inadequate calcium and vitamin D intake and osteoporosis risk in older Americans living in poverty with food insecurities.” Plos One, Published online ahead of print on July 8, 2020

    Stratum Nutrition to distribute NatAxtin branded astaxanthin in North America

    August 12, 2020

    Stratum Nutrition has entered into a distribution agreement with Atacama Bio Natural Products for its NatAxtin branded astaxanthin.

    astaxanthin
    Photo © AdobeStock.com/ExQuisine

    Stratum Nutrition, a business of ESM Technologies (Carthage, MO), entered into a value-added distribution agreement for NatAxtin brand astaxanthin, manufactured by Atacama Bio Natural Products (Iquique, Chile).

    "We are really excited to launch NatAxtin branded astaxanthin in North America and could not ask for a better partner than Stratum Nutrition to accomplish this,” said Jose Luis Arenas, founder and CEO of Atacama Bio, in a press release.

    NatAxtin is a competitively priced astaxanthin that combines the benefits of an optimal microbial source and ideal production conditions, resulting in an ingredient that meets or exceeds the high standards demanded by conscientious dietary supplement manufacturers.

    "Stratum is well on a path to leadership in supplying all-natural and proven-effective dietary solutions,” said Micah Osborne, President of Stratum Nutrition, in a press release. “Bringing NatAxtin brand astaxanthin into Stratum's highly selective portfolio fully complements the range of unique plant, animal, and probiotic ingredients we produce and distribute."


    Pharmavite’s new Caring by Nature initiative supports nurse practitioners’ health as they deal with COVID-19 work stress

    August 12, 2020

    Pharmavite's Caring by Nature program has evolved into a program that offers numerous channels to help nurse practitioners bolster their health and wellness during the pandemic.

    Pharmavite’s new Caring by Nature initiative supports nurse practitioners’ health as they deal with COVID-19 work stress
    Photo © iStockphoto.com/kupicoo

    Nutrition industry professionals are taking stock of how they can help their communities during the COVID-19 pandemic. Many other industries have found ways to assist others in this difficult time. Makers and sellers of dietary supplements have long had a mission, through their products, to help consumers fill nutrient gaps and stay well. It’s a role that remains critical at a time when staying healthy is of utmost concern.

    We have seen industry companies find numerous ways to support their communities in recent months. Some have produced and donated hand sanitizer, such as Best Formulations, Califormulations, and Symrise did. Others, such as Jiaherb Inc., have donated personal protective equipment to those on the front lines. Still others have donated significant funds to help their communities who are in need of a wide range of relief, such as the nonprofit Dr. Majeed Foundation recently did in India, or Kyowa Hakko USA recently did in New York. These are just a few examples of how supplement companies have found ways to help.

    Recently, the Pharmavite corporation announced a new initiative called Caring by Nature, which specifically focuses on helping nurse practitioners better care for themselves as they battle on the pandemic front line. In early March, even before nationwide lockdowns started, the company surveyed 350 nurse practitioners in the U.S. to determine how these workers were managing their own wellbeing.

    “The original intent of the survey was to better understand what nurse practitioners prioritize in their health routines and what factors dictate their behaviors,” explains Alan McNamara, Pharmavite’s divisional vice president of corporate communications. “Once we conducted our survey, COVID-19 quickly came to the forefront and it was apparent we needed to lend our support beyond sharing the insights we gathered.”

    The Caring by Nature program has evolved into a program that offers numerous channels to help nurse practitioners bolster their health and wellness during the pandemic. These include educational resources and interactive options such as virtual yoga classes led by professional instructors as well as free care packages containing products from Pharmavite’s Nature Made brand. These are “products designed to help support relaxation and stress-reduction,” McNamara says. Nurse practitioners can register via the following link to participate in the Caring by Nature program for free: http://www.jaanpresourcecenter.com/specialty/pharmavitenatmade.html.html.html.

    Pharmavite also harnessed the partnership of the American Association of Nurse Practitioners to help drive the initiative’s exposure and extend its reach. “Similarly, we have partnered with select nurse practitioner social influencers to speak to the survey results as well as the yoga classes and care package offerings,” McNamara says.

    Nurse practitioners are a group that needs this kind of support, especially in the high-stress and hazardous environment they now face due to COVID-19. One finding from Pharmavite’s survey is that nurse practitioners generally prioritize their health and wellness behind the needs of others.

    “Our survey was fielded in early March at the start of the global pandemic. It’s no secret that healthcare professionals like nurse practitioners have always worked tirelessly for the greater good of their patients, but the results were eye-opening,” McNamara says. “Our survey found that nearly half (44%) of nurse practitioners reported being ‘too tired’ as the top reason preventing them from taking better care of themselves and their health.” In fact, 54% of respondents said that work commitments prevent them from taking better care of their health.

    McNamara says this spurred the company to find a tangible way to support this group of healthcare workers. “Our key takeaway that nurse practitioners generally put the care and wellbeing of others above their own needs really struck a chord given the toll the pandemic was taking on both frontline healthcare workers and the healthcare system itself,” he says. “Rather than just raise awareness around this issue, we wanted to do something that might help them through this difficult time.”

    One finding of the survey was that even as nurse practitioners push other personal health priorities to the side, one thing they do prioritize is the use of dietary supplements. The survey found 77% of respondents reporting routinely taking a vitamin and/or a dietary supplement daily, primarily citing immune system support and filling nutrient gaps as the main reasons. Says McNamara, “[D]espite their busy schedules, the majority of nurse practitioners reported that regularly takin vitamins or supplements is the last healthy habit to fall by the wayside, in comparison to other habits such as eating healthy or exercising. When you layer in the impact COVID-19 has had on our healthcare system, these findings are likely amplified.”

    McNamara says Pharmavite is also “definitely open to expanding the reach of this program to other healthcare workers. Any future iterations of this program would be tailored to providing resources and supporting the needs of that specific group of healthcare workers.”

    He adds: “Pharmavite has been a longtime supporter of the healthcare professional community by investing in education on nutrients for this vital group of individuals who are trusted sources of information for their patients.” By spreading the word and encouraging the use of dietary supplements, companies like Pharmavite are demonstrating to healthcare providers as well as the people those providers influence about how supplements can play a beneficial role in this difficult time. While supplements cannot in any way prevent, treat, or cure COVID-19, they can help consumers take care of their themselves at a time when everyone is worried about their health.

    download issueDownload Issue : Nutritional Outlook Vol. 23 No. 6

    https://www.nutritionaloutlook.com/view/pharmavite-s-new-caring-by-nature-initiative-supports-nurse-practitioners-health-as-they-deal